

National air quality standards
Ecology and local clean air agencies monitor and track emissions to make sure levels of outdoor air pollutants meet federal and state air quality standards. We focus on EPA's "criteria" pollutants and other chemicals broadly known as air toxics. Our programs and strategies prevent air pollution from reaching levels that are unhealthy for people or the environment.
Criteria air pollutants
The federal Clean Air Act requires EPA to set National Ambient Air Quality Standards (NAAQS) for six common air pollutants. We monitor these pollutants and take action if levels become unhealthy. The pollutants are:
- Carbon monoxide (CO)
- Lead (Pb)
- Nitrogen dioxide (NO2)
- Ozone (O3)
- Particle or particulate matter (PM)
- Sulfur dioxide (SO2)
Air toxics
EPA established a list of 188 hazardous air pollutants. We regulate over 430 toxic air pollutants from commercial and industrial sources. We prioritized 21 of those toxic air pollutants because of their health risk. To reduce levels of these priority pollutants, we are working to reduce diesel emissions and wood smoke.
Air toxics monitoring
We track air pollution throughout Washington. Since 2000, we have been measuring air toxics at our Seattle-Beacon Hill air quality monitoring station. By comparing long-term trends to current readings, we have determined that most toxic pollutant levels are going down. This shows that driving clean cars helps keep the air healthy.
We have also partnered with local clean air agencies to identify and monitor pollutants that are the greatest health risk. Reports from some of the studies include:
- Seattle and Tacoma area (2010)
- Longview (2005) and (2009)
- Vancouver (2005)
- Spokane (2005)
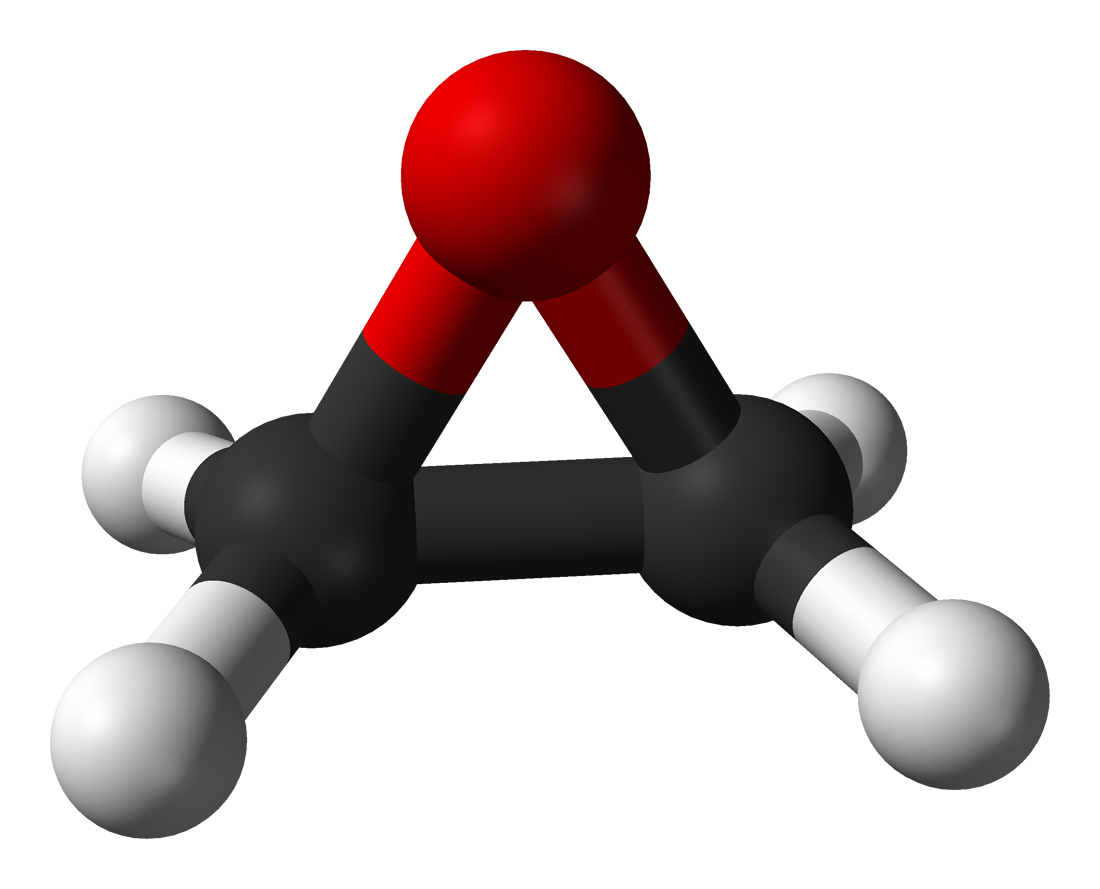
An ethylene oxide molecule
Air toxics monitoring — ethylene oxide
Recent research shows that air pollution from the chemical ethylene oxide is more common and more unhealthy than we previously thought. We are working with EPA, local clean air agencies, and environmental agencies in other states to figure out:
- Which sources emit ethylene oxide.
- Which communities may have more ethylene oxide air pollution.
- What can be done to reduce ethylene oxide emissions and protect people's health.
Ethylene oxide (EtO) is a colorless, flammable gas. At very high levels, it smells like ether. EPA has classified ethylene oxide as an air toxic. It is a chemical ingredient used in solvents, antifreeze, textiles, plastics, and glues. It is also used to sterilize medical and dental equipment — particularly plastics that are difficult to sterilize with steam.
EPA's most recent National Air Toxics Assessment identified several locations that may have higher cancer risks from long-term exposure to ethylene oxide. Most of these places are close to where ethylene oxide is made or to industries that use the chemical.
Even though none of these locations are in Washington, Ecology's air quality monitoring station near downtown Seattle has found ethylene oxide. Based on this and on studies from other areas, we are following this as an emerging health concern.
Exposure to ethylene oxide can irritate the eyes, skin, nose, throat, and lungs. Studies show that breathing the chemical over a long time increases the risk of certain types of cancer, including non-Hodgkin's lymphoma, myeloma, lymphocytic leukemia, and breast cancer.
Related links
- Air quality mobile app
- Apple: Air Quality WA
- Google/Android: Air Quality WA
- Air Quality Index (AQI)
- Air quality studies
- State Implementation Plan (SIP)
Contact information
Gary Palcisko
Toxicologist
gary.palcisko@ecy.wa.gov
360-995-3447