

Water quality monitoring methods for rivers & streams
Our long-term river and stream monitoring team collects long-term data to track trends in stream health and contribute to watershed studies and water quality improvement plans. Our water quality scientists also maintain a network of continuous monitoring stations, in partnership with our streamflow scientists, to collect 24-hour data for dissolved oxygen, temperature, pH, and conductivity in many rivers and streams statewide. Learn how we measure Washington freshwater quality below.
Monitoring plan and operating procedures
- Quality Assurance Monitoring Plan: Statewide River and Stream Ambient Water Quality Monitoring is the latest long-term monitoring plan.
- Standard Operating Procedure (SOP) — Ambient Freshwater Water Quality Monitoring contains our published Standard Operating Procedures.
Types of monitoring stations
Each of our stream-monitoring stations is a long-term, sentinel, basin, or specific study station.
| Type of station | Number of stations | Timing and purpose of monitoring |
| Long-term | 66 | Measured monthly every year, primarily for trends |
| Sentinel | 8 | Measured monthly every year, for reference conditions, trends due to climate change, and to support other types of monitoring |
| Basin | 12 | Monthly for one year to support the Water Quality Assessment and especially to help refine category assignments for the Assessment |
We may monitor additional stations in some years to support special projects.
How we collect samples
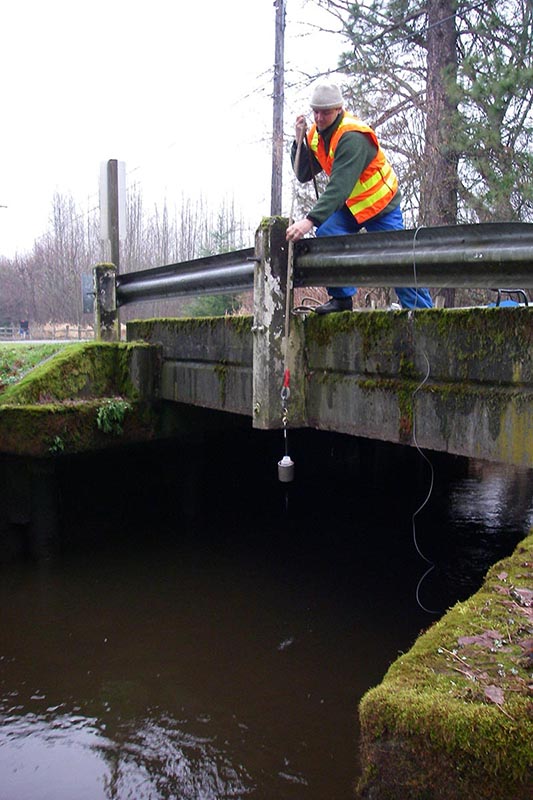
Collecting a water sample from a bridge.
We have stream ecologists statewide collecting monthly samples from stations year round. Each scientist covers a region of the state. Contact us to learn more.
Our ecologists use a rope and weighted containers to collect single surface-grab samples from highway bridges or, depending on accessibility, from the stream bank. Temperature is measured in-stream using a long-line thermistor or electronic tracking device. Water samples are measured in the field, or are processed for shipment to the Manchester Environmental Laboratory. In addition, they measure streamflow at long-term and some basin stations.
Learn about data quality
Data quality assurance for rivers & streams describes what we do to ensure that our results are accurate and consistent.
Analytes and parameters measured
Routinely analyzed indicators of water quality are listed in the table below. Additional constituents are sometimes measured to meet special needs.
SM = Standard Methods for the Examination of Water and Wastewater; EPA = Methods for Chemical Analysis of Water and Wastes Links for these methods lead to PDF documents on EPA's website.
Analyte table
| Indicator | Method |
|---|---|
| bacteria, fecal coliform | SM 9222D |
| ammonia | SM 4500 NH3H |
| conductivity | SM 2510B |
| streamflow | Streamflow methods |
| metals | EPA 200.8 and 245.7 |
| nitrate plus nitrite | SM 4500 NO3I |
| nitrogen, total | SM 4500 NB |
| oxygen | SM 4500 OC |
| pH | EPA 150.2 (pdf) |
| phosphorus, soluble reactive | SM 4500 PG |
| phosphorus, total | SM 4500 PH* |
| suspended solids | SM 2540 D |
| temperature | thermistor |
| turbidity | SM 2130 |
| bacteria, E. coli | SM 9222D |
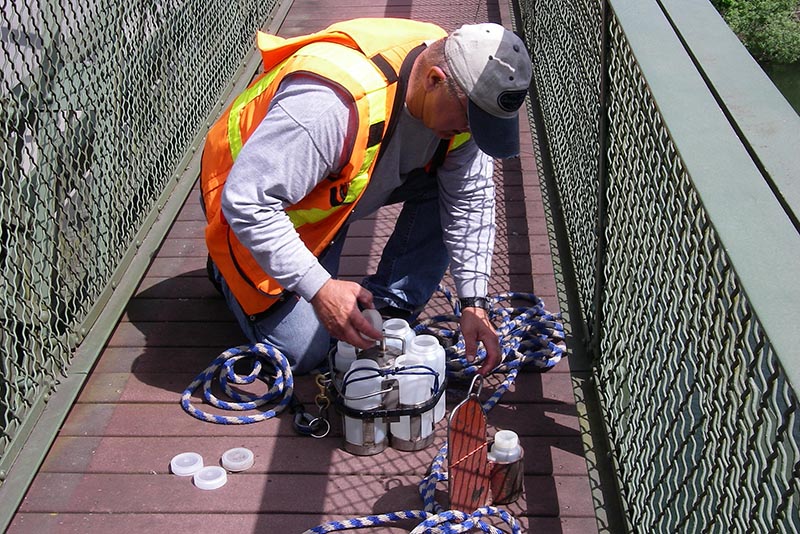
Several samples can be collected at once.
*Note on total phosphorus: As of June 2018, EPA program 40 CFR Part 136 requires the minimum detection limit (MDL) for SM4500 PH to be reported as 0.066 parts per billion and the reporting limit (RL) as 0.10 ppb.
Parameter table
SM = Standard Methods for the Examination of Water and Wastewater; EPA = Methods for Chemical Analysis of Water and Wastes
| Parameter | Code in data | Description | Method | STORET code | Unit | Detection limit |
|---|---|---|---|---|---|---|
| Conductivity | COND | Measured with Beckman meter which could not be field calibrated. Formerly EIM method SM 2510-B. | SM 2510F | P95 | umhos/cm | 0 |
| Bacteria, fecal coliform | FC | SM16-909C | P31616 | #/100ml | 1 | |
| Streamflow | FLOW | Ecology rating | RATINGF | P60 | CFS | 0 |
| Ammonia – Nitrogen | NH3_N | Collected in acid-washed passenger, acid-preserved, shipped on ice. EIM Method was EPA350.1 prior to 05/01 | SM4500NH3H | P610 | mg/L | 0.01 |
| Nitrate – Nitrogen | NO3_N | Method originally assumed to be EPA352.1; changed to SM in 2004. | SM4500NO3I | P620 | mg/L | 0.01 |
| Phosphorus, Sol Reactive | OP_DIS | Collected in acid-washed passenger, acid-preserved, shipped on ice. EIM Method was EPA365.3M prior to May 2001 | SM4500PG | P671 | mg/L | 0 |
| Oxygen | OXYGEN | Winkler with biodate correction for thiosulfate (after Feb. 1989). | EPA 360.2 | P300 | mg/L | 0 |
| pH | PH | Liquid probe (mostly low ionic strength probe), calib. 3x daily. | PHMETERF | P400 | pH | 1 |
| Barometric pressure | PRESS | Both analog and digital | BAROF | P25 | mm/Hg | 0 |
| Suspended solids, TSS | SUSSOL | — | SM2540D | P530 | mg/L | 1 |
| Temperature | TEMP | thermistor in river | TEMPTHERMF | P10 | deg C | 0 |
| Phosphorus, total | TP_P | Collected in acid-washed passenger, acid-preserved, shipped on ice. Sometimes from Manchester Lab as SM4500PI, sometimes as EPA 365.1. | EPA365.1 | P665 | mg/L | 0.01 |
| Total Persulfate Nitrogen | TPN | Collected in acid-washed passenger, acid-preserved, shipped on ice. Manchester/reg10 VAX call this P100021. (Former method: "valderama") | SM4500NB | P600 | mg/L | 0.01 |
| Total Persulfate Nitrogen, Dissolved | TPN_DIS | Collected in acid-washed passenger, field-filtered, acid-preserved, shipped on ice. | SM4500NB | — | mg/L | 0.01 |
| Turbidity | TURB | — | SM2130 | P82079 | NTU | 1 |
Dashes (—) indicate no data available.
Related links
Contact information
Markus Von Prause
Ambient Water Quality Monitoring Lead
mark.vonprause@ecy.wa.gov
360-305-8179