

Oxygen & nutrients in Puget Sound
Many parts of Puget Sound and the Salish Sea have oxygen levels that are below the levels needed for marine life to thrive. In some parts of Puget Sound, low levels of oxygen persist for most of the year.
Many physical, chemical, and biological factors influence dissolved oxygen levels in Puget Sound. These include:
- The quality and timing of water entering Puget Sound from the Pacific Ocean
- Local circulation patterns
- Air and water temperature
- Salinity
- The timing and size of river flows
- Factors influencing nutrient retention as well as nutrient loading from various sources
When water quality standards are not met, we are mandated by the federal Clean Water Act to initiate a study. Our water quality assessment of state waters shows that Puget Sound dissolved oxgen levels are not meeting standards. We are working on reducing excess nutrients through the Puget Sound Nutrient Reduction Project.
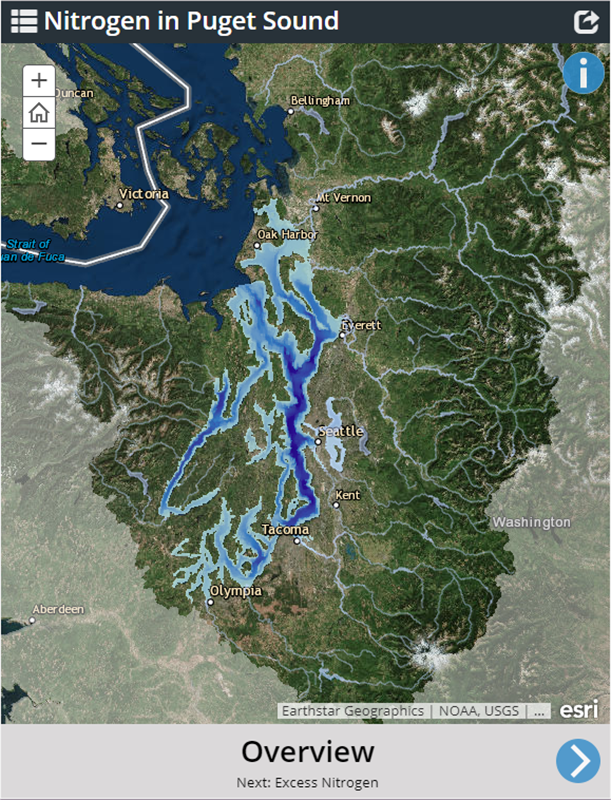
Nitrogen in Puget Sound - A story map
We're involved in various efforts to understand how, and to what extent, excess nitrogen and other nutrients are a problem. This involves identifying nitrogen sources, monitoring nitrogen levels, analyzing how things are changing, and determining what we need to do to improve water quality.
This Nitrogen in Puget Sound story map, created by our scientists, allows you to explore what we know about nitrogen in Puget Sound.
Nutrients contribute to low oxygen levels
Both nitrogen and organic carbon contribute to dissolved oxygen depletions. Too much nitrogen fuels excessive marine algae growth. When the algae dies and decomposes, oxygen is consumed.
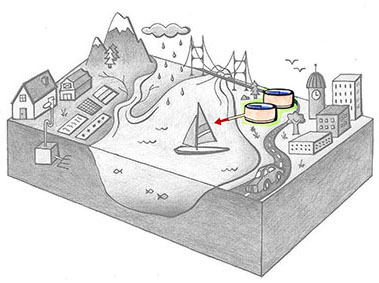
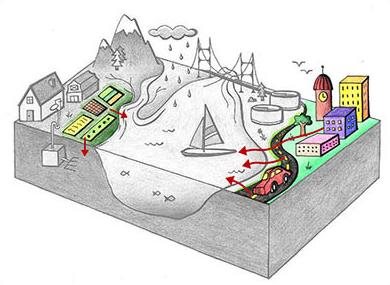
Nitrogen sources
Nitrogen is a nutrient that is naturally present in marine waters, along with other nutrients such as phosphorus and carbon. While marine life does need some nitrogen to grow, excess nitrogen can fuel the excessive growth of algae. These algae eventually die, sink to greater depth, and decompose — a process that uses up oxygen in the water. In this way, too much nitrogen can decrease oxygen levels in Puget Sound.
See the list below to learn more about several sources of nitrogen in Puget Sound and how they are changing:
Measuring changes
We have been monitoring the marine waters of Puget Sound for more than 20 years. Changes in marine water quality show that nitrogen concentrations are increasing within Puget Sound, and the cycling of nutrients is changing. In addition to lowering oxygen levels, changes in nitrogen can also affect food-web dynamics and, in turn, affect aquatic plants, fish, benthic organisms, and other marine life, resulting in other changes to the marine ecosystem.
What we are doing?
Our marine monitoring and freshwater monitoring efforts provide us with valuable data to track changes in dissolved oxygen and nitrogen. In addition, we are developing and using the Salish Sea Model, a computer-modeling tool, to better understand this complex system and the relative influence of different factors that contribute to low dissolved oxygen in Puget Sound and the Salish Sea. This model is used to identify what needs to be done to reduce nutrients entering Puget Sound and guide management actions. One regulatory action we are taking is developing a Puget Sound Nutrient General Permit for wastewater treatment plants that discharge to Puget Sound.